
Written by: Michael A. Stewart, Agri-Solar Financial Analyst
Expertise: 12+ years in renewable energy project finance, specializing in agricultural solar applications. Former project lead for the World Bank’s rural electrification initiative, focused on solar water pumping systems across sub-Saharan Africa and South Asia. Holds a Master’s degree in Energy Engineering from Delft University of Technology and has advised over 150 farms on transitioning from diesel to solar irrigation.
Why Your Current Water Pump is Burning Your Profits
For most farmers, water pumping isn’t just an operational necessity—it is a silent profit killer. Every time you start that diesel generator or your electric meter spins, you are watching your bottom line evaporate.
The Diesel Drain: If you rely on diesel, you know the pain. Fuel prices in early 2026 have been hovering at record highs in many regions, with some markets seeing prices between the equivalent of $1.20 to $1.50 per liter for agricultural diesel. A medium-sized farm can easily burn through 8 to 10 liters of diesel per day during peak irrigation season. That translates to thousands of dollars annually—money that could otherwise be invested in seeds, equipment, or expansion.
The Grid Gamble: Farmers connected to the electrical grid face a different kind of uncertainty. Power outages are unpredictable, voltage fluctuations can damage sensitive equipment, and electricity tariffs seem to rise every year. In many rural areas, the grid is unreliable at best and non-existent at worst. When your crops need water during a dry spell, waiting for the grid to come back online isn’t an option.
The Hidden Costs: Beyond the direct fuel or electricity bills, there are other drains on your profitability:
- Maintenance: Diesel engines require regular oil changes, filter replacements, and mechanical repairs. A major breakdown during harvest season can be catastrophic.
- Labor: Someone has to refuel, monitor, and maintain that diesel pump. That’s labor hours that could be spent on productive farm work.
- Logistics: Transporting fuel to remote fields adds time and expense. Running out of fuel at a critical moment means lost irrigation time and stressed crops.
The Real-World Impact: Studies from 2026 have demonstrated that the financial burden of traditional pumping is not trivial. One report found that solar water pumps can increase farmers’ gross profits by up to 186% within two crop seasons, compared to conventional irrigation methods. Another case study documented a 47% increase in land utilization, 84% higher yields, and a 136% boost in income per acre after switching to solar-powered irrigation.
These aren’t just environmental victories—they are financial transformations. And they are achievable on farms of all sizes, from smallholders to large-scale commercial operations.
The Solution: Solar Water Pumps – Your 25-Year Partner in Profitability
A solar water pump system does exactly what it sounds like: it uses energy from the sun to move water from your source (well, borehole, river, pond, or reservoir) to where it is needed—your fields, livestock, or storage tanks.
The concept is deceptively simple, yet remarkably robust. Here is how it works:
System Diagram / Flowchart
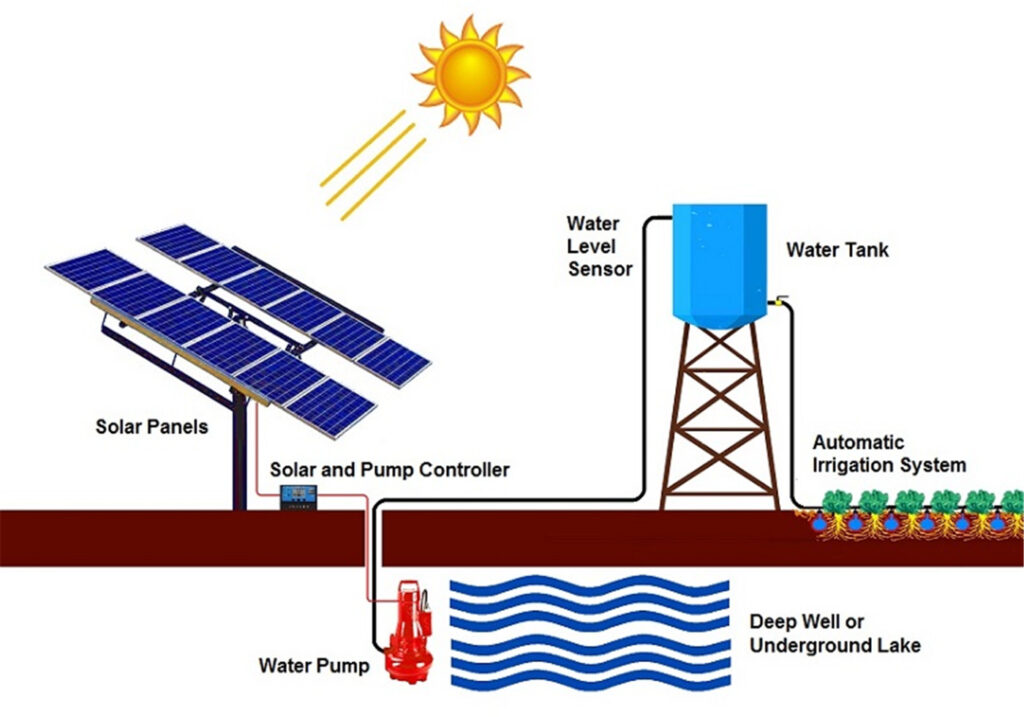
System Diagram / Flowchart Explanation:
Step 1: Energy Capture (Solar Panels)
Photovoltaic (PV) panels convert sunlight directly into direct current (DC) electricity. The size of your solar array determines how much power you can generate.
Step 2: Power Conditioning (Controller/Inverter)
The controller manages the flow of electricity, optimizing the panels’ output using Maximum Power Point Tracking (MPPT) technology. If you are using an AC pump, the inverter converts DC from the panels (or batteries) into AC power.
Step 3: Optional Storage (Battery Bank)
Some systems include batteries to store excess solar energy for use during cloudy periods or at night. This enables 24/7 pumping capability.
Step 4: Water Movement (Pump)
The electricity powers the pump, which moves water from your source. There are two main types:
- Surface Pumps: For moving water from rivers, ponds, or shallow wells.
- Submersible Pumps: Placed deep inside a borehole or well, pushing water upward.
Step 5: Water Delivery (Distribution)
Water travels through pipes to your fields via drip irrigation, sprinklers, or flood irrigation—whatever suits your crops.
Types of Solar Water Pumps
| Pump Type | Best For | Typical Depth | Pros | Cons |
|---|---|---|---|---|
| Submersible DC Pump | Deep wells, boreholes | 15–150+ meters | Efficient at depth, quiet, durable | Higher upfront cost, requires professional installation |
| Surface DC Pump | Rivers, ponds, shallow wells | 0–10 meters | Lower cost, easy to install, portable | Limited to shallow water sources |
| AC Pump + Inverter | Large farms, grid-tied setups | Any depth | Compatible with grid backup, high flow rates | Inverter adds cost, some efficiency loss |
| Hybrid (Solar + Battery) | Farms needing 24/7 water | Any depth | Round-the-clock operation, energy independence | Batteries increase initial investment (adds 20–40% to system cost) |
Key Components Explained for Beginners
- Solar Panels: The “fuel source.” In 2026, panel prices have dropped over 70% compared to a decade ago, making solar the most cost-effective option for many farms.
- MPPT Controller: The “smart brain.” It adjusts electrical parameters to harvest the maximum possible power from your panels, even under partial shading or changing light conditions.
- The Pump Itself: The “workhorse.” Brushless DC pumps are increasingly popular for their efficiency and lack of mechanical wear parts.
- Pipes & Fittings: The “veins.” Ensure they are UV-resistant and appropriately sized to minimize friction losses.
- Water Storage Tank (Optional but Recommended): The “battery for water.” Allows you to pump during sunny hours and use the stored water anytime, reducing or eliminating the need for electrical batteries.
The Numbers Behind the Success: Engineering and Financial Analysis
An investment in solar water pumping must be justified on the balance sheet. Below is a rigorous financial and technical comparison modeling a standard 7.5 kW (10 HP) irrigation setup operating under typical modern agricultural conditions, delivering roughly 45,000 gallons of water per day at a total dynamic head (TDH) of 200 feet.
Let’s get to the part that matters most: the money. Below, I break down the economics using 2026 market data so you can see precisely what a solar water pump can do for your farm’s bottom line.
Financial Assumptions (2026 Market Baseline)
- Daily Water Requirement: 45,000 Gallons
- System Size: 7.5 kW (10 HP) Pump matched with a 10.5 kWp Solar PV Array (over-paneled to ensure early morning and late afternoon performance).
- Diesel Generator Fuel Consumption: 0.65 gallons per hour.
- Diesel Cost: $4.20 per gallon (regional average baseline).
- Grid Electricity Cost: $0.16 per kWh + Peak Demand Surcharges.
- Solar System Lifespan: 25 Years (Panels); 10 Years (Controller); 10 Years (Pump).
Comparison Matrix: Solar vs. Diesel vs. Utility Grid
| Financial & Operational Metric | Solar PV Pumping System | Diesel Generator Unit | Utility Grid (Full Connection) |
|---|---|---|---|
| Initial Capital Expense (CapEx) | $14,500 | $4,500 | $12,000 (Inclusion) |
| Annual Fuel/Energy Cost | $0 | $5,920 | $3,450 |
| Annual Maintenance Expense | $150 (Cleaning & inspection) | $1,200 (Oil, filters, repairs) | $200 (Breakdown) |
| Total Year 1 Operating Cost | $150 | $7,120 | $3,650 |
| 5-Year Cumulative Cash Outflow | $15,250 | $40,100 | $30,250 |
| 10-Year Cumulative Cash Outflow | $19,250 (Includes controller swap) | $80,200 | $52,500 |
| Asset Lifespan | 25+ Years | 4 to 6 Years (Engine overhaul) | Variable (Grid dependent) |
| Carbon Footprint Impact | Zero Direct Emissions | High CO₂ & Particulate | Medium to High mix |
Return on Investment (ROI) and Payback Calculation
To calculate the simple payback period for transitioning from a diesel generator asset to a solar pumping system, we use the net upfront cost difference divided by the annual operational savings:
\[ \text{Payback Period} = \frac{\text{CapEx}_{\text{Solar}} – \text{CapEx}_{\text{Diesel}}}{\text{OpEx}_{\text{Diesel}} – \text{OpEx}_{\text{Solar}}} \]Using our modeled values:
\[ \text{CapEx Difference} = \$14,500 – \$4,500 = \$10,000 \] \[ \text{Annual OpEx Savings} = \$7,120 – \$150 = \$6,970 \] \[ \text{Payback Period} = \frac{\$10,000}{\$6,970} \approx 1.43 \text{ Years} \]