
Written by Michael A. Stewart, Agri‑Solar Engineering Consultant. 12+ years designing solar water pumping systems and interpreting pump curves for hundreds of farm applications across the United States. Has taught pump curve reading to farmers, technicians, and extension agents. Holds a Master’s in Energy Engineering (Delft University) and is a member of the Irrigation Association.
The Datasheet Mystery
You are shopping for a solar pump. You have your flow and head requirements from the sizing guide. You download datasheets from Grundfos, Lorentz, and Franklin. Each one shows a graph filled with lines, axes, and numbers that seem to make no sense.
The salesperson says, “This pump will work for you.” But how can you verify? How do you know which pump will actually deliver the flow you need at the head you have? How do you compare efficiency between models? And how do you know when your pump is wearing out?
This is the problem: Pump performance curves are the language of pump selection. If you can’t read them, you are flying blind. You might oversize (wasting money) or undersize (starving your crops). You might choose an inefficient pump that costs you thousands in extra solar panels. And you might miss the early warning signs of wear that could have been caught with a simple curve check.
This guide demystifies pump curves. By the end, you will be able to:
- Read the three essential curves: Q‑H (flow vs. head), efficiency, and power.
- Find the Best Efficiency Point (BEP) and understand why it matters.
- Compare two pumps side‑by‑side using their curves.
- Use curves to size a pump for your specific farm conditions.
- Spot signs of pump wear by comparing actual performance to the curve.
The Three Curves You Need to Know
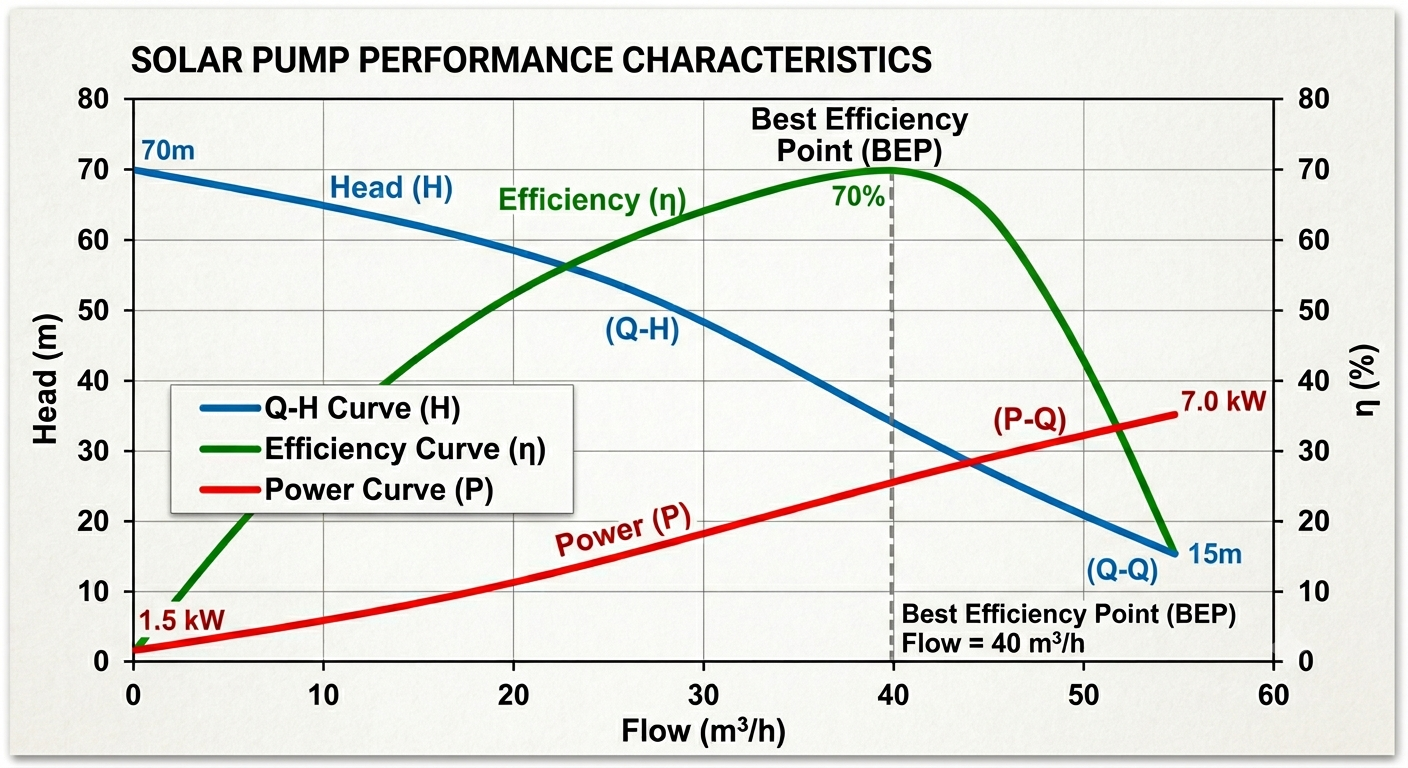
Every solar pump datasheet contains at least three curves plotted on the same graph. They are:
| Curve | What It Shows | Shape |
|---|---|---|
| Q‑H (Flow‑Head) | Flow rate (horizontal axis) vs. total head (vertical axis) | Steadily decreasing – as head increases, flow decreases |
| Efficiency (η) | Pump efficiency at each operating point | Bell‑shaped – peaks at the BEP |
| Power (P) | Electrical or shaft power required | Increasing – more flow requires more power |
Why all three matter: The Q‑H curve tells you what the pump can do. The efficiency curve tells you how well it does it. The power curve tells you how much energy it will consume. All three are needed to size your solar array, estimate operating costs, and choose the best pump.
Reading the Q‑H (Flow‑Head) Curve
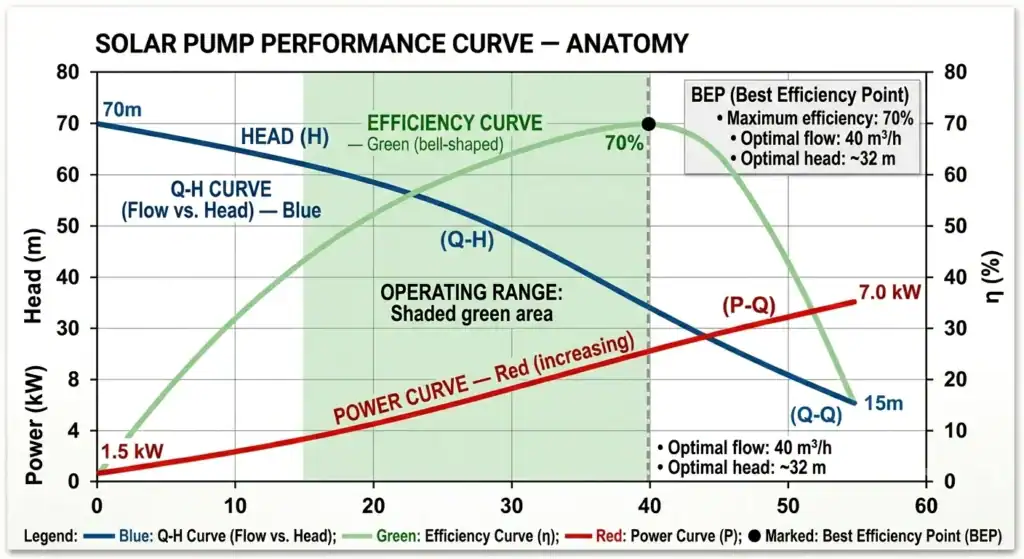
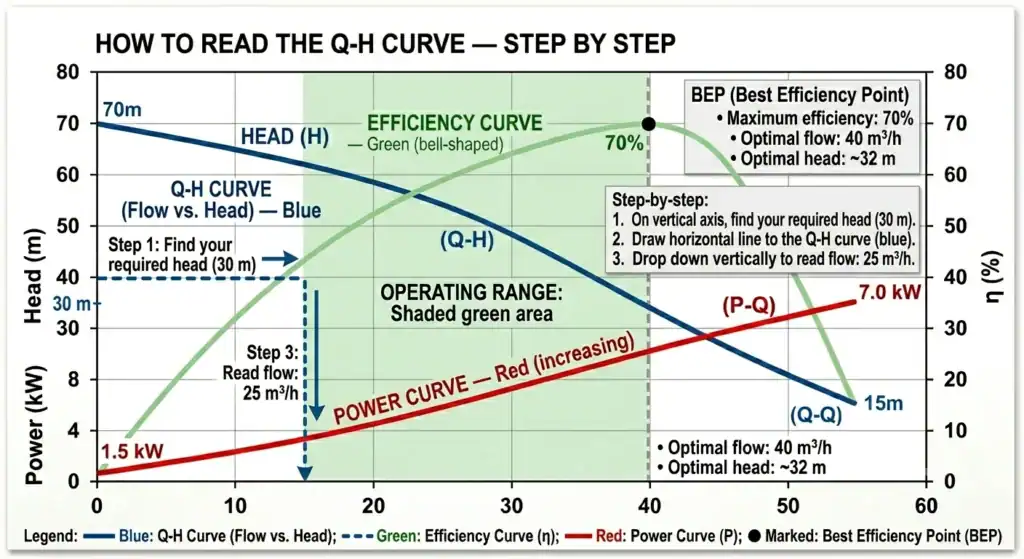
The Q‑H curve is the most important line on the graph. It answers the question: “At a given head, how much water will this pump deliver?”
How to Read It
- Find your required head on the vertical axis (e.g., 30 meters).
- Draw a horizontal line from that point to the Q‑H curve.
- Drop down vertically to the horizontal axis to read the flow rate (e.g., 25 m³/h).
Example: A pump curve shows that at 30 m head, the pump delivers 25 m³/h. If your system requires 30 m head and you need 25 m³/h, this pump is a match.
What the curve tells you:
- Maximum flow is at the lowest head (right side of curve).
- Maximum head is at the lowest flow (left side, often called “shut‑off head”).
- As head increases, flow decreases – this is a fundamental property of centrifugal pumps.
Multiple Speed Curves
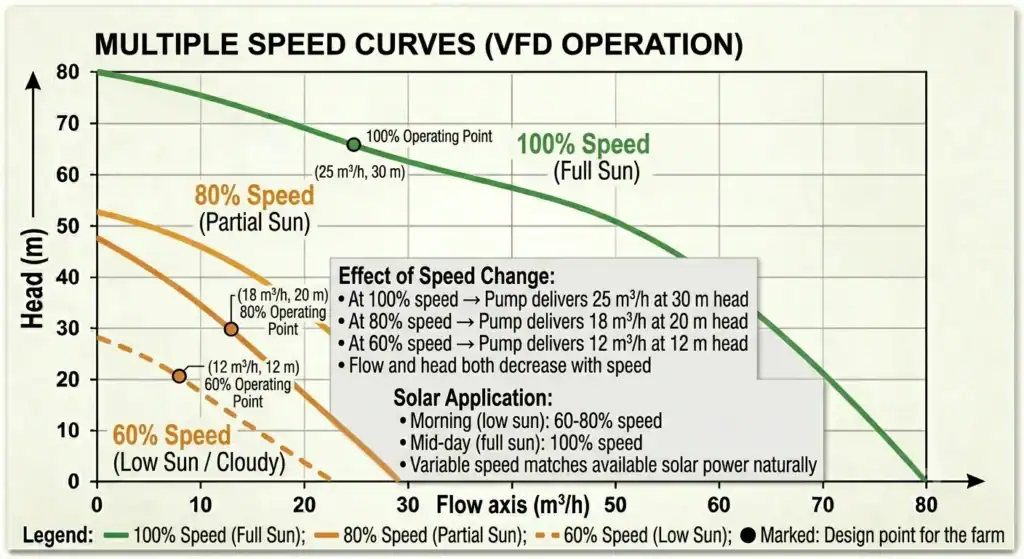
Many solar pumps operate at variable speeds (via VFD or MPPT). Datasheets often show multiple Q‑H curves for different speeds or frequencies.
| Speed | Curve Position | Interpretation |
|---|---|---|
| Low speed | Lower curve (less flow at same head) | Morning/evening or low sun |
| Rated speed | Middle curve | Full sun, typical operation |
| High speed | Upper curve | Over‑speed (rare) |
How to use multiple curves: If your solar system will operate at varying sun levels, you need to check the flow at the curve corresponding to your average solar input. For example, at 60% speed, the pump may deliver only 60‑70% of the rated flow.
Reading the Efficiency Curve
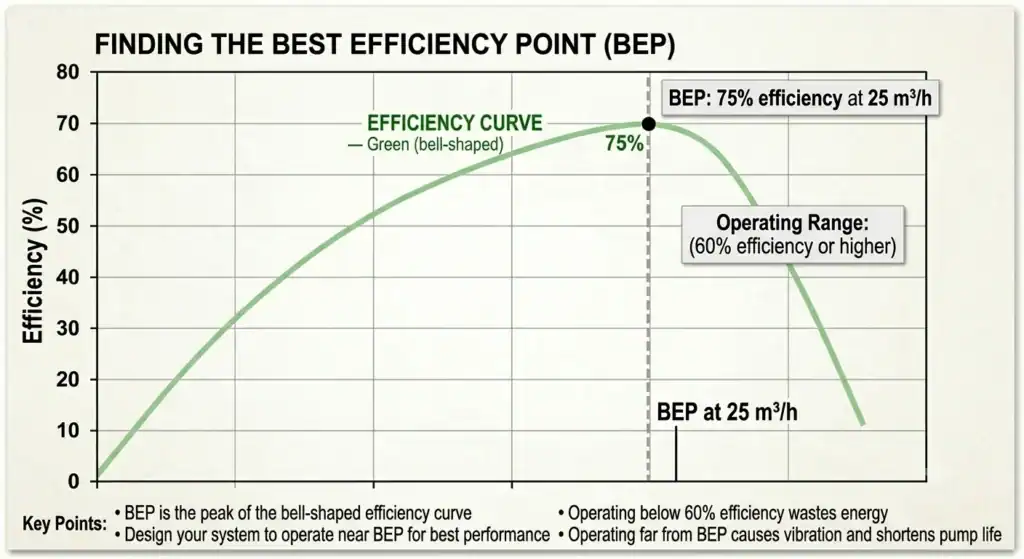
The efficiency curve (η) shows how efficiently the pump converts mechanical (or electrical) energy into hydraulic energy. It is bell‑shaped – low at the extremes, peaking somewhere in the middle.
Why Efficiency Matters for Solar
| Efficiency | Meaning | Impact |
|---|---|---|
| High (e.g., 75‑80%) | Most energy goes to moving water | Smaller solar array, lower cost |
| Low (e.g., <50%) | Much energy wasted as heat | Larger array, higher cost, more heat |
The Best Efficiency Point (BEP): This is the operating point where the pump efficiency is maximum. It is usually marked on the curve. For a solar pump, you should design your system to operate near the BEP as much as possible.
Example: A pump has BEP at 30 m head, 25 m³/h, 75% efficiency. If you operate it at 20 m head, flow may be higher but efficiency drops to 60%. You would need a larger array to compensate. If you operate at 40 m head, flow drops, efficiency drops, and you are wasting energy.
Why BEP matters for wear: Operating far from BEP causes increased vibration, noise, and stress on bearings and seals. Pumps that constantly run off‑BEP fail prematurely.
How to Find the BEP
- Locate the efficiency curve (bell shape).
- Find the peak of the bell – the highest point.
- Drop down vertically to read the flow at BEP.
- Read the head at that flow from the Q‑H curve.
Typical BEP for solar pumps: Many solar pumps have BEP in the middle third of their operating range. For a pump rated 20‑60 m head, BEP might be around 30‑40 m.
Reading the Power Curve
The power curve shows the electrical power (kW) or shaft power required to drive the pump at each operating point.
Why Power Matters for Solar
The power curve tells you how many solar panels you need. If your pump requires 3.2 kW at BEP, and you have 5 peak sun hours, your solar array must be sized to deliver that power under real‑world conditions.
Formula: Array size (kWp) = Pump power (kW) ÷ (Motor efficiency × Controller efficiency) × 1.25 (safety factor)
Example: Pump power at BEP = 3.2 kW. Motor efficiency = 0.88, controller = 0.96. Array size = 3.2 ÷ (0.88 × 0.96) × 1.25 = 4.73 kWp.
How to read the power curve:
- At your chosen operating point (flow and head), read the corresponding power from the power curve.
- This is the hydraulic power – what the pump impeller uses. Shaft power = hydraulic power ÷ pump efficiency.
Using Curves to Size a Pump – A Real Example
Let us size a solar pump for a 25‑acre almond orchard using the curves.
Step 1: Determine required flow and head.
- Flow requirement: 48 m³/h (from Section 4 of the orchard guide).
- Total dynamic head (TDH): 77 meters (well lift 30m + friction 5m + filter 2m + pressure 40m).
Step 2: Find the pump curve.
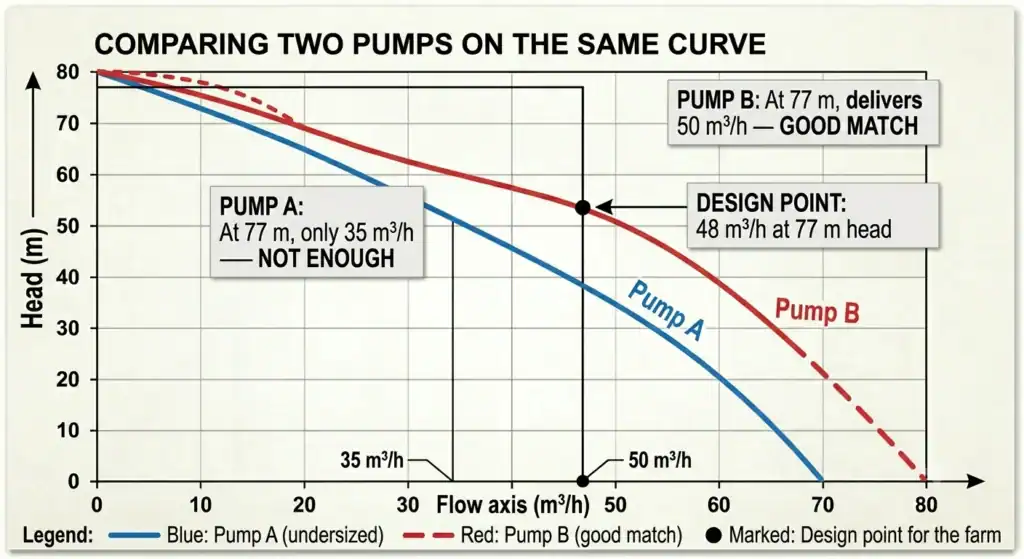
We have two candidate pump curves (e.g., Pump A and Pump B). We plot our design point (48 m³/h at 77 m head).
Step 3: Check if the design point falls on or below the Q‑H curve.
- Pump A: At 77 m head, the curve shows only 35 m³/h. Not enough.
- Pump B: At 77 m head, the curve shows 50 m³/h. Slightly above our requirement – good, gives margin.
Choose Pump B.
Step 4: Verify efficiency at the design point.
- At 77 m head and 50 m³/h, the efficiency curve shows 72%.
- Compare to BEP (maybe 78% at 60 m head). 72% is acceptable. If efficiency were below 60%, consider a different pump.
Step 5: Read power at design point.
- The power curve at 77 m and 50 m³/h shows 10.5 kW hydraulic power.
- Shaft power = 10.5 ÷ 0.72 = 14.6 kW.
- Solar array = 14.6 ÷ (0.88 × 0.96) × 1.25 = 21.6 kWp (about 40 panels at 550W).
Step 6: Check the operating range.
- The pump should operate between 60‑90% of BEP flow for good efficiency. At 50 m³/h and BEP maybe 55 m³/h, we are at 91% – perfect
Comparison Table – Pump A vs. Pump B
| Parameter | Pump A | Pump B |
|---|---|---|
| Flow at 77 m head | 35 m³/h | 50 m³/h |
| Efficiency at design point | 68% | 72% |
| Hydraulic power at design point | 7.4 kW | 10.5 kW |
| Shaft power | 10.9 kW | 14.6 kW |
| Array size | 16 kWp | 21.6 kWp |
| Cost (pump + array) | $12,000 | $15,500 |
| Verdict | ❌ Undersized | ✅ Good match |
Diagnosing Pump Wear with Curves
As pumps wear, their performance changes. The Q‑H curve drops – for a given head, the pump delivers less flow. The efficiency curve shrinks – peak efficiency decreases.
Signs of Wear from the Curve
| Observation | Likely Cause |
|---|---|
| Flow at design head is 10‑20% lower than the original curve | Impeller wear, increased clearances |
| Efficiency has dropped noticeably | Worn wear rings, diffuser damage |
| Power consumption is higher for same flow | Internal recirculation, bearing friction |
| Vibration or noise increases | Misalignment, bearing wear |
How to detect wear:
- Record your pump’s actual flow, head, and power at a known operating condition (e.g., mid‑day full sun).
- Compare these values to the original manufacturer curve.
- If actual flow is significantly lower than the curve for the same head, your pump is wearing.
- A drop of >10% usually indicates significant wear and the need for maintenance or replacement.
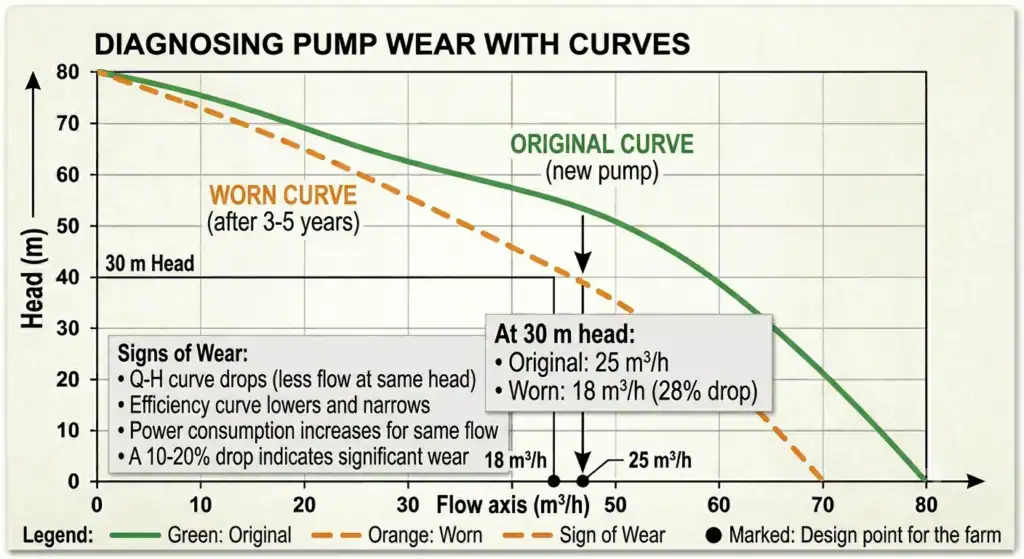
Practical tip: Install a flow meter and pressure gauge. Log readings monthly. A 5‑10% drop over a season is normal; a sudden 15‑20% drop is a warning.
Expert Tips – Reading Curves Like a Pro
Tip 1: Always check the NPSH (Net Positive Suction Head) if you have a surface pump.
NPSH curves show the minimum suction pressure required to avoid cavitation. If your NPSH available is less than NPSH required, the pump will cavitate – loud noise, vibration, and rapid impeller damage. Many solar pump datasheets include an NPSH curve; check it if your pump is above ground.
Tip 2: Use the specific speed to compare pumps across brands.
Specific speed is a dimensionless number that characterizes pump geometry. Pumps with similar specific speed have similar Q‑H curve shapes. This helps when comparing different manufacturers – you can quickly see if a pump is designed for high flow/low head or low flow/high head.
Tip 3: Look for the minimum and maximum operating limits.
Manufacturers often mark a shaded region on the curve indicating safe operation. Operating outside this region (e.g., far to the right, below the minimum flow) can cause overheating, cavitation, or excessive vibration. Stay within the recommended operating window.
Tip 4: For solar pumps, prefer pumps with flat Q‑H curves.
A flat curve means flow changes little with head variations – useful when solar input varies throughout the day. A steep curve means flow changes dramatically with small head changes, which can be problematic in variable solar conditions.
Tip 5: Use ISO efficiency standards to compare brands.
Not all efficiency curves are measured the same way. Look for pumps tested to ISO 9906 or Hydraulic Institute standards. A pump claiming 75% efficiency may actually be 70% if tested under different conditions. ISO standards ensure apples‑to‑apples comparison.
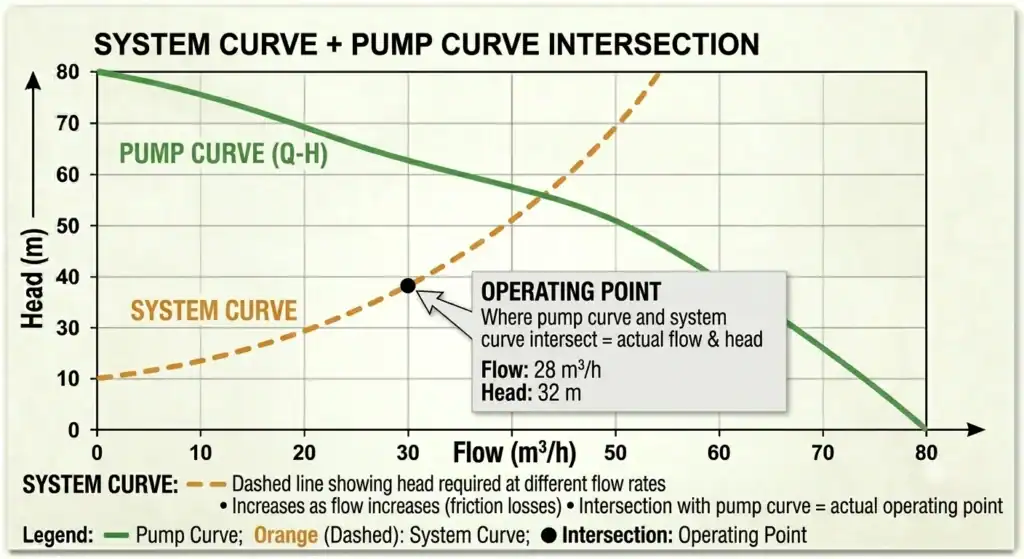
Tip 6: Plot your system curve on the same graph.
Your system curve shows the head required at different flow rates (due to friction losses). The intersection of the pump curve and the system curve is your operating point. If you don’t plot the system curve, you’re guessing where the pump will actually run.
Tip 7: Re‑check curves after 5 years.
Manufacturers revise curves as pump designs improve. A pump you bought 5 years ago may have been superseded by a more efficient model. If you are adding new panels or replacing a pump, download the latest curve – you might find a better match.
Conclusion
Pump performance curves are not just technical drawings – they are your guide to making smart decisions about sizing, comparing, and maintaining your solar water pump.
Key takeaways:
| Takeaway | Why It Matters |
|---|---|
| Read all three curves – Q‑H, efficiency, power – together. | Efficiency tells you how well the pump works; power tells you how much it costs to run. |
| Find the BEP and design near it. | Saves energy, extends pump life. |
| Plot your system curve to find the real operating point. | Avoids guesswork and expensive mistakes. |
| Check the curve after installation to verify pump is working as specified. | Catches installation errors or defective pumps. |
| Monitor your pump over time and compare to the original curve. | Early warning of wear, prevents sudden failure. |
Your action plan:
- When choosing a pump, download the datasheet and find the Q‑H, efficiency, and power curves.
- Mark your design point (flow and head) on the graph.
- Ensure the design point falls on or below the Q‑H curve, and within the efficient range (near the BEP).
- Read the power at that point and size your solar array accordingly.
- After installation, measure actual flow, head, and power – compare to the curve.
- Log readings monthly and watch for curve drift – a sign of wear.
The curve is your pump’s fingerprint. Learn to read it, and you will always know exactly what your pump can do.
Frequently Asked Questions (FAQ)
Q: What is the difference between head and pressure on a pump curve?
Head and pressure measure the same thing — the energy a pump imparts to water — but in different units. Head is measured in feet (or meters) of water column. Pressure is measured in PSI (pounds per square inch).
The conversion is constant:
- 1 PSI = 2.31 feet of head
- 1 foot of head = 0.433 PSI
Pump curves use head because it is independent of fluid density. A pump producing 100 feet of head will lift water 100 feet regardless of whether the water is fresh, salty, or mixed with fertilizer. Pressure, by contrast, changes with fluid density.
Q: How do I calculate total dynamic head (TDH) for my solar pump?
Total Dynamic Head (TDH) is the sum of four components:
- Elevation Head — the vertical distance from the water surface to the highest discharge point
- Pressure Head — the pressure your irrigation system requires, converted to feet (1 PSI = 2.31 feet)
- Friction Head — the energy lost as water flows through pipes and fittings, calculated using friction loss tables
- Velocity Head — the energy of water in motion (usually negligible for agricultural systems)
The formula: TDH = Elevation Head + Pressure Head + Friction Head + Velocity Head
Example: Well depth 200 ft (dynamic level 150 ft), tank 30 ft above ground, drip system at 25 PSI, 500 ft of 2-inch pipe with fittings.
- Elevation: 150 + 30 = 180 ft
- Pressure: 25 × 2.31 = 57.8 ft
- Friction: 16.9 ft (from tables)
- Velocity: 0 ft (negligible)
- TDH = 254.7 feet
Q: What is the best efficiency point (BEP) on a pump curve?
The Best Efficiency Point (BEP) is the flow rate and head combination where the pump operates at its maximum hydraulic efficiency. Operating at the BEP minimizes energy consumption, vibration, and wear, maximizing pump lifespan.
For agricultural solar pumps, the ideal operating range is 70% to 110% of the BEP flow. Operating below 50% of BEP causes overheating and recirculation. Operating above 120% of BEP causes cavitation — the formation of destructive air bubbles at the impeller.
© 2026 Solar Panels for Farms. All data sourced from Grundfos Ecademy, Franklin Electric technical documentation, Northridge Pumps engineering guides, and USDA-ARS research publications. Last verified: June 24, 2026.