Written by Dr. Robert Kowalski a Ph.D. in Agricultural and Biological Engineering from Penn State University and has 18 years of experience in on-farm electrical systems and performance diagnostics. He has conducted more than 150 solar system performance audits for farm operations and has served as an expert witness in warranty disputes. He is a licensed Professional Engineer and a member of the American Society of Agricultural and Biological Engineers.
Year one, your farm solar system produced 40,000 kWh more than the installer projected. Year two was close to projection. Year three was 8% under. Year four was 12% under. Now, in year five, your utility bill shows the system producing 15% below the original estimate — and you are not sure whether to call the installer, clean the panels, or file a warranty claim.
This is the most common complaint among farm solar owners after the first few years, and it is almost always met with the same vague answer: “some degradation is normal.”
Some degradation is normal. Panels lose output over time, and a rate of 0.5% per year is typical for modern modules. Over five years, that alone accounts for about 2.5% of the shortfall. The remaining 12% must have another cause — and most of the time, it does.
The problem is that underperformance is a category, not a diagnosis. The lost production could come from soiling, shading, inverter clipping, string failure, connector corrosion, a failing bypass diode, or a dozen other causes. Each has a different remedy, and some are covered by warranty while others are the owner’s responsibility.
Most farm solar owners lack the framework to distinguish between them, which leads to two bad outcomes: either the owner ignores a real failure and loses production for years, or the owner pays for remediation that was actually a warranty claim the manufacturer should have covered.
This guide provides the diagnostic framework used in professional performance audits.
The Four-Step Diagnostic Flowchart
Diagnosing underperformance is a process of elimination. Each step narrows the possible causes.
Step 1 — Establish the baseline correctly.
The single most common error in underperformance diagnosis is comparing current production to the installer’s original projection. That projection was based on assumptions — typical weather year, estimated soiling losses, assumed degradation — and a shortfall against a projection is not the same as a shortfall against performance.
The correct baseline is expected production for actual conditions. This requires normalizing for actual irradiance (sunlight received) and actual temperature during the period in question. Many monitoring platforms calculate this automatically.
Step 2 — Compute the performance ratio.
Performance ratio (PR) is the ratio of actual energy produced to the theoretical energy the system would produce at its nameplate rating under the actual irradiance received. It is the single most useful health metric for a solar system.
| System Type | Healthy PR Range | Investigate If |
|---|---|---|
| New installation (year 1) | 0.80 – 0.86 | Below 0.78 |
| Mature installation (year 5+) | 0.76 – 0.83 | Below 0.72 |
| Installation with known soiling exposure | 0.72 – 0.80 | Below 0.68 |
PR below these thresholds indicates a loss that is not explained by normal degradation. At that point, proceed to Step 3.
Step 3 — Compare string-level production.
Most monitoring platforms report production by string or by MPPT input. If all strings are producing similarly and all are down by the same percentage, the cause is likely system-wide: soiling, shading, or an inverter-wide issue. If one string is significantly below the others, the cause is specific to that string: a failed connector, a cracked panel, a blown bypass diode, or a wiring fault.
This single comparison resolves the majority of diagnostic questions.
Step 4 — Physical inspection and thermal imaging.
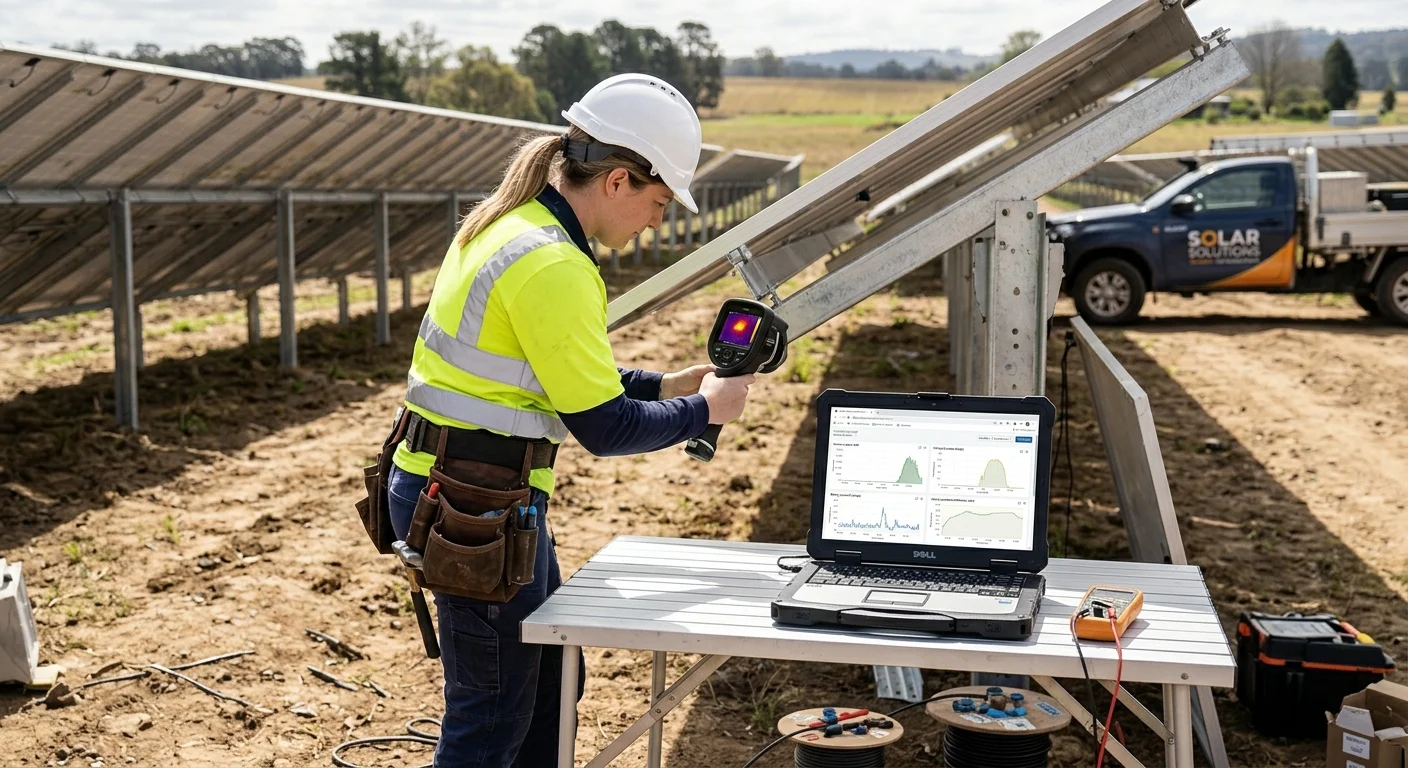
Once the pattern is identified, a physical inspection confirms the cause. Thermal imaging — using an infrared camera — reveals hot spots that indicate cell damage, bypass diode failure, or connector resistance. This is the step that generates the evidence needed for a warranty claim.
The Numbers Behind the Success: Common Causes and Their Signatures
| Cause | Typical Loss | Diagnostic Signature | Remediation Cost | Warranty Coverage |
|---|---|---|---|---|
| Soiling (dust, pollen, bird droppings) | 3% – 8% | Uniform loss across all strings | $500 – $2,500 (cleaning) | Not covered |
| Inverter clipping | 2% – 5% | Flat-topped production curve at midday | None (design issue) | Not covered |
| Shading (new tree growth, new structure) | 5% – 25% | Loss concentrated at specific times of day | $500 – $5,000 (trimming or relocation) | Not covered |
| String failure (connector, wiring) | 10% – 25% of one string | One string producing zero or near-zero | $500 – $2,000 | Depends on cause |
| Bypass diode failure | 3% – 10% | Thermal image shows hot spot on panel | $200 – $800 per panel | Often covered |
| Potential Induced Degradation (PID) | 5% – 15% | Gradual system-wide decline over years | $2,000 – $10,000 (mitigation) | Sometimes covered |
| Connector corrosion | Variable | Thermal image shows hot connector | $200 – $1,500 | Depends on cause |
| Panel cracking (hail, thermal stress) | Variable | Visible cracking or micro-cracks; thermal signature | Panel replacement | Often covered by insurance |
Worked Example: Diagnosing a 15% Shortfall on a 100 kW Farm Array
System details:
- Capacity: 100 kW
- Installed: 2021
- Location: Iowa
- Monitoring: String-level (4 strings, 25 kW each)
- Reported issue: Year 5 production 15% below installer projection
Step 1 — Baseline correction: Normalizing for actual irradiance, expected production for the period is 6% below the installer’s original projection. So the real shortfall is 9%, not 15%.
Step 2 — Performance ratio check: Calculated PR is 0.71 — below the 0.72 investigate threshold for a year-5 system. Confirms a genuine issue.
Step 3 — String comparison:
| String | Expected (kWh) | Actual (kWh) | Shortfall |
|---|---|---|---|
| String 1 | 32,000 | 31,700 | 0.9% |
| String 2 | 32,000 | 31,500 | 1.6% |
| String 3 | 32,000 | 31,800 | 0.6% |
| String 4 | 32,000 | 24,800 | 22.5% |
Three strings are performing within normal degradation. String 4 is producing 22.5% below expected — a clear local fault.
Step 4 — Physical inspection: Thermal imaging reveals two panels on String 4 with pronounced hot spots in the lower third of the module. Visual inspection shows micro-cracking consistent with a thermal stress event (likely a hailstorm in year 3 that was not reported at the time).
Outcome:
- Root cause: Two cracked panels on String 4, with bypass diodes now conducting.
- Remedy: Panel replacement.
- Warranty coverage: Micro-cracking from hail is typically covered by homeowner or farm property insurance, and sometimes by manufacturer warranty depending on the cause.
- Estimated cost if not covered: $1,200 for two panels plus $400 labor.
- Recovered annual production: ~7,200 kWh (worth ~$865 at $0.12/kWh).
Expert Tips
1. Know your performance ratio benchmark. If your system is more than three years old and your PR has dropped below 0.72, there is a genuine issue worth investigating. Normal degradation alone does not produce PR declines of that magnitude. Monitoring platforms vary in how they calculate PR, so confirm the methodology being used.
2. Check string-level data, not just system-level. If your monitoring only reports system-level production, you cannot distinguish a system-wide problem from a single-string fault. String-level monitoring is worth the modest additional cost — it typically pays for itself in one avoided diagnostic service call.
3. Thermal imaging is the fastest diagnostic tool. A professional thermal scan takes one to two hours on a typical farm array and identifies cracked cells, failed bypass diodes, hot connectors, and failing junction boxes. Most installers offer this as a service call for $300 to $800. It is almost always worth the cost before committing to any remediation.
4. Document everything from day one. Photograph panel serial numbers at installation. Save the commissioning report. Keep monitoring screenshots. A warranty claim is dramatically easier when you can demonstrate the system was performing correctly and then declined — and manufacturers dispute claims that lack a baseline.
5. Soiling loss is recoverable — and worth recovering. In agricultural environments, soiling losses often exceed the 3% to 8% range because of dust, pollen, and agricultural sprays. Cleaning typically costs $500 to $2,500 for a farm array, and it can recover 3% to 8% of annual production. At $0.12/kWh on a 100 kW system producing 150,000 kWh/year, an 8% recovery is worth about $1,440 per year — a strong return on a cleaning cost.
6. Watch for PID on older systems. Potential Induced Degradation is a specific failure mode that affects some older panel models, particularly in high-voltage string configurations in humid conditions. It is often reversible with mitigation equipment. If your system is more than six years old and shows a gradual system-wide decline beyond normal degradation, PID should be on the diagnostic shortlist.
Conclusion
Underperformance is a category, not a diagnosis. The 15% shortfall that prompts a service call may be 6% weather variance, 3% soiling, 2% normal degradation, and 4% a genuine fault that is covered by warranty.
The diagnostic path is systematic. Establish the actual baseline by normalizing for weather. Compute the performance ratio. Compare string-level production to isolate the fault. Then use thermal imaging to confirm the cause and generate the evidence needed for a claim.
Most farm solar systems never receive a professional performance audit. This is a missed opportunity — both because real faults go unrepaired and cost the owner thousands of dollars per year in lost production, and because owners sometimes pay out of pocket for repairs that were warranty-covered.
A system that is performing correctly pays for itself. A system that is silently losing 10% per year does not. The diagnostic framework in this article is what separates the two.
Frequently Asked Questions
Q: Why is my solar system producing less than expected?
A: The most common causes are weather variance (actual irradiance differs from the projection’s assumed weather), soiling (dust, pollen, and agricultural spray on the panels), shading from new tree growth or construction, inverter clipping, and genuine equipment faults such as cracked panels or failed bypass diodes. The correct diagnostic approach is to first normalize production for actual weather conditions, then compute the performance ratio, then compare string-level production to isolate whether the loss is system-wide or localized. Only after this sequence can you identify the actual cause.
Q: How much do solar panels degrade per year?
A: Modern panels typically degrade at 0.5% per year, which is the figure most manufacturers warrant for 25 to 30 years. Some models warrant slightly lower rates. This means a system that is 10 years old should show roughly 5% total degradation from baseline. If your system shows more than that — especially if the shortfall is not uniform across strings — the loss is not degradation and should be diagnosed as a separate issue.
Q: How do I know if my solar panels are failing?
A: The clearest signals are a string-level production imbalance (one string producing significantly less than the others), a performance ratio below the healthy threshold for your system age, visible cracking or discoloration on the panel surface, and thermal imaging hot spots. A professional thermal scan is the fastest diagnostic tool and typically costs $300 to $800 for a farm array. It identifies cracked cells, failed bypass diodes, hot connectors, and failing junction boxes in a single site visit.
Related Articles
- How to Clean Solar Panels on a Farm (Without Breaking Them) — Recovering soiling losses safely.
- Solar DC Fan Maintenance: The 45-Minute Checklist That Prevents $2,000 Replacements — Preventive maintenance that reduces failure rates.
© 2026 Farm Solar Guide. All data sourced from ASAE water system standards, manufacturer cold-temperature specifications, EIA fuel price projections, and documented US farm operations. Last verified: October 13, 2026