
Written by Michael Torres a Chartered Financial Analyst with 11 years of experience in renewable energy project finance. He has analyzed agricultural utility tariffs across 30 states and has advised farm clients on load-shifting strategies to maximize solar self-consumption value. He holds an M.B.A. in Finance from the University of Chicago Booth School of Business and a B.S. in Agricultural Economics from Texas A&M University.
The Problem
The way most farm solar ROI is calculated assumes electricity has a single price. You produce a kilowatt-hour, you avoid a kilowatt-hour of purchase, and the value is your retail rate.
On a flat-rate tariff, that is correct. On a time-of-use (TOU) tariff, it is not.
TOU tariffs price electricity differently depending on when it is consumed. Peak periods — typically late afternoon and early evening — carry the highest rates. Off-peak periods — typically overnight and early morning — carry the lowest. Midday rates fall somewhere in between, though in some regions with high solar penetration, midday rates have become the cheapest of all because of oversupply.
This creates a structural problem for farm solar economics that most ROI calculators ignore entirely.
A solar array produces the majority of its output during midday hours. If your utility’s highest rates are in the late afternoon and evening — which is typical for TOU tariffs — then the electricity your array produces at midday is worth less than the electricity you consume in the evening. The array produces when electricity is cheap; the farm consumes when electricity is expensive.
The gap between production value and consumption cost is the load-shifting opportunity. And on most farms, it is significant.
There is a second layer of complexity: demand charges. Many agricultural tariffs include a demand charge based on the farm’s peak 15-minute usage during the billing period. This charge is often larger than the total energy charge. A farm that reduces its peak demand by scheduling loads intelligently can reduce its bill far more than the raw kilowatt-hour savings would suggest.
Most farm solar content ignores both of these dynamics. This article addresses them directly.
The Solution: Four Load-Shifting Strategies That Require No New Equipment
Load shifting means moving consumption from expensive hours to cheap hours. On a farm with solar, the cheapest hours are the ones when your array is producing — which means load shifting and solar self-consumption reinforce each other.
Four strategies apply to most farms.
Strategy 1 — Irrigation scheduling.
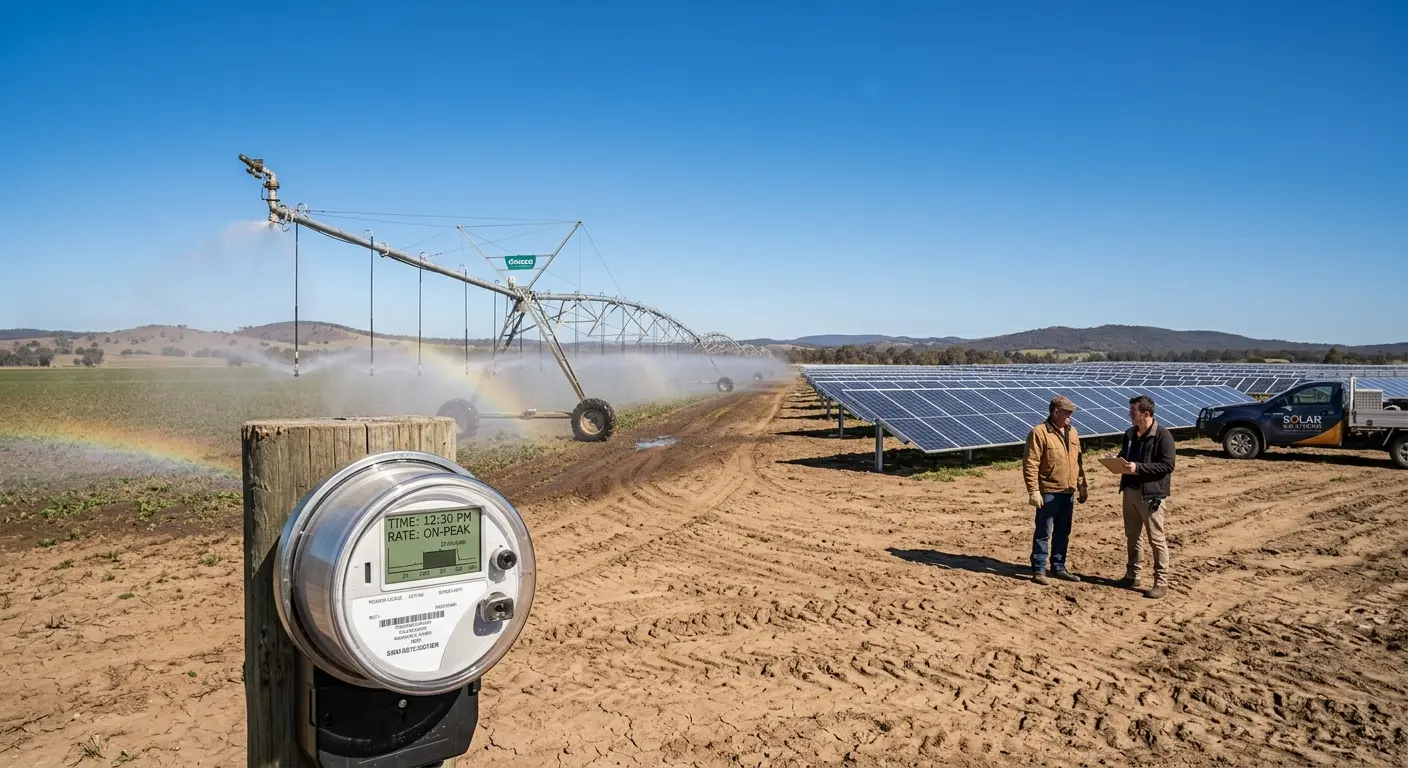
Irrigation is the largest shiftable load on many farms. A center pivot or a large pump can run at any hour of the day, and the crop does not care when the water arrives. Under a TOU tariff, scheduling irrigation to run during solar production hours captures the full retail value of the solar electricity instead of exporting it at a low rate.
Strategy 2 — Cold storage pre-cooling.
Cold storage rooms and milk cooling systems can be pre-cooled during solar hours, then allowed to drift upward during peak-rate hours while remaining within safe temperature ranges. The thermal mass of the stored product provides a buffer. This is a well-established strategy in commercial refrigeration and applies directly to farm operations.
Strategy 3 — Water heating timing.
Dairy parlors and other operations with large hot water demand can schedule heating cycles to run during solar production hours rather than overnight. A well-insulated tank holds temperature for hours, so the timing of the heating cycle is flexible.
Strategy 4 — Battery arbitrage.
If you have a battery system, it can store excess solar production during midday and discharge it during peak-rate hours. This captures the spread between midday production value and peak consumption cost. The economics of battery arbitrage depend on the rate spread and the battery’s cost per cycle.
The Numbers Behind the Success: Irrigation Scheduling on a 250 kW Farm
System and tariff assumptions:
- Farm solar system: 250 kW, producing 375,000 kWh/year
- Self-consumption without load shifting: 65% (typical for unscheduled irrigation)
- Irrigation load: 100 kW pump running 6 hours/day during the irrigation season (150 days/year)
- Utility tariff: TOU with three periods
| Period | Hours | Rate |
|---|---|---|
| Off-peak | 10 PM – 7 AM | $0.06/kWh |
| Mid-peak | 7 AM – 2 PM | $0.10/kWh |
| Peak | 2 PM – 10 PM | $0.18/kWh |
Scenario A — Irrigation scheduled for evening hours (default practice)
The pump runs from 4 PM to 10 PM, which falls entirely in the peak period.
| Item | Calculation | Value |
|---|---|---|
| Irrigation energy consumption | 100 kW × 6 hr × 150 days | 90,000 kWh |
| Peak-rate energy cost | 90,000 kWh × $0.18 | $16,200 |
| Solar electricity exported during irrigation hours (not consumed) | ~60,000 kWh | — |
| Export compensation at avoided cost | 60,000 kWh × $0.04 | $2,400 |
| Net annual value | — | –$13,800 |
Scenario B — Irrigation scheduled for midday hours
The pump runs from 10 AM to 4 PM, which captures solar production.
| Item | Calculation | Value |
|---|---|---|
| Irrigation energy consumption | 100 kW × 6 hr × 150 days | 90,000 kWh |
| Solar electricity consumed on-site | 90,000 kWh | — |
| Energy cost avoided (mid-peak rate) | 90,000 kWh × $0.10 | $9,000 |
| Reduced peak-period consumption | — | — |
| Net annual value | — | +$9,000 |
The difference between the two scenarios: $22,800 per year.
That is the value of moving the irrigation schedule by six hours. No new equipment, no capital investment. Just operational scheduling discipline.
| Metric | Evening Irrigation | Midday Irrigation | Difference |
|---|---|---|---|
| Irrigation energy consumption | 90,000 kWh | 90,000 kWh | — |
| Self-consumption rate | 65% | 89% | +24 points |
| Annual energy value | –$13,800 | +$9,000 | +$22,800 |
| Solar payback period (250 kW, $280k net) | 8.6 years | 6.3 years | –2.3 years |
Impact on overall solar ROI:
| Metric | Before Load Shifting | After Load Shifting |
|---|---|---|
| Annual solar value | $39,000 | $61,800 |
| Simple payback | 7.2 years | 4.5 years |
| 25‑year net return | $695,000 | $1,265,000 |
| ROI improvement | — | +$570,000 |
The Demand Charge Layer
Many agricultural tariffs include demand charges that are separate from energy charges. A demand charge is typically billed as dollars per kilowatt of peak 15-minute demand during the billing period.
Example: If your farm’s peak demand is 200 kW and the demand charge is $12 per kW, the monthly demand charge is $2,400, or $28,800 per year. This can exceed the total energy charge for farms with concentrated load profiles.
Solar can reduce demand charges only if it produces during the peak demand window. If your peak demand occurs in the evening after the sun has set — which is common on farms with evening irrigation or milking — solar does not help with demand charges at all.
Load shifting does help. Moving irrigation from evening to midday shifts the demand peak away from the expensive window, reducing the demand charge.
Demand charge example:
| Scenario | Peak Demand | Demand Charge ($12/kW) | Annual Cost |
|---|---|---|---|
| Evening irrigation (peak at 8 PM) | 185 kW | $2,220/month | $26,640 |
| Midday irrigation (peak at 1 PM) | 145 kW | $1,740/month | $20,880 |
| Annual savings | — | — | $5,760 |
Combining energy and demand charge savings, the total annual benefit of shifting irrigation from evening to midday on this example is approximately $28,560.
Expert Tips
1. Ask your utility for the correct agricultural TOU rate by name. Many utilities have multiple agricultural rate classes, and the one you are on may not be the one that best fits your load profile. Ask specifically about TOU rates designed for irrigated agriculture, and compare them against your current rate using 12 months of interval data.
2. Pull 15-minute interval data before you make any scheduling decisions. Annual consumption totals tell you nothing about load shifting potential. Interval data shows you exactly when your farm consumes electricity, and it is the only way to model the financial impact of scheduling changes accurately. Most utilities provide interval data for free or for a small fee.
3. Do not ignore the demand charge interaction. On many agricultural tariffs, demand charges are the larger component of the bill. Scheduling changes that reduce peak demand can save more than the energy charge reduction. Model both.
4. Automate the scheduling so it survives the busy season. The single greatest failure mode of load shifting is that it works in the spring when the farmer is paying attention, and breaks down during harvest when nobody is watching the clock. Use irrigation controllers, timer relays, or building automation systems to enforce the schedule automatically.
5. Coordinate with your battery if you have one. If you have a battery, discharge it during peak hours and charge it during midday solar production. This captures the rate spread automatically and does not require operational discipline.
6. Watch for TOU rate changes and demand charge restructures. Tariffs change. A rate structure that rewarded evening irrigation in 2020 may penalize it in 2026. Review your tariff annually, especially if you are considering a solar expansion.
Conclusion
Your solar array produces the same electricity regardless of when your pumps run. But under a TOU tariff, the value of that electricity changes by the hour, and the way you schedule your loads determines whether your solar investment delivers a 4.5-year payback or an 8.6-year payback.
Irrigation is the largest shiftable load on most farms. Scheduling it to run during solar production hours — instead of evening peak hours — can add $22,800 per year in energy value and reduce demand charges by an additional $5,760 on a typical 250 kW farm. Combined, that is roughly $28,500 per year of additional value from a scheduling change that requires no capital investment.
Add cold storage pre-cooling, water heating timing, and battery arbitrage, and the total load-shifting opportunity can reach 15% to 30% of your total solar ROI.
The first step is a call to your utility to confirm your tariff and request 15-minute interval data. The second step is a scheduling audit. The third is automation.
Most farm solar owners never do any of these. That is why the ROI multiplier remains invisible.
Frequently Asked Questions
Q: What are time-of-use rates for farms?
A: Time-of-use rates are utility tariffs that charge different prices for electricity depending on the time of day. Peak periods, typically late afternoon and early evening, carry the highest rates. Off-peak periods, typically overnight, carry the lowest. Farms on TOU tariffs can significantly reduce their electricity costs by scheduling flexible loads — particularly irrigation — to run during lower-rate periods. On farms with solar, the optimal schedule is usually during midday solar production hours, which avoids both peak rates and low-value export compensation.
Q: How does irrigation scheduling affect my solar savings?
A: Irrigation is typically the largest shiftable load on a farm. If irrigation runs during evening peak-rate hours, the solar array’s production is either exported at a low avoided-cost rate or consumed at a time when it does not offset expensive electricity. If irrigation runs during midday solar production hours, every kilowatt-hour the array produces is consumed on-site at the full retail rate. In the worked example in this article, shifting irrigation from evening to midday increased annual solar value by $22,800 and reduced the payback period from 8.6 years to 6.3 years.
Q: Can I reduce my farm’s demand charges with solar?
A: Solar reduces demand charges only if it produces electricity during your peak demand window. If your peak demand occurs in the evening after sunset, solar does not directly reduce it. Load shifting does reduce demand charges by moving the peak demand away from expensive hours. Combined approaches — solar production during the day plus load shifting to keep peak demand low — can reduce demand charges significantly, sometimes by more than the energy charge savings. Request 15-minute interval data from your utility to model the impact accurately.
Related Articles
- Farm Net Metering 2026: How Export Rate Cuts Change Your Solar ROI — Why self-consumption value matters more than ever.
- Solar vs Diesel Irrigation Pivot: The $41,000/Season Center-Pivot Question — The baseline cost of irrigation energy.
- Farm Solar Battery Sizing: The 2026 Complete Guide — Capturing the rate spread automatically.
© 2026 Farm Solar Guide. All data sourced from ASAE water system standards, manufacturer cold-temperature specifications, EIA fuel price projections, and documented US farm operations. Last verified: October 15, 2026